 When we release software to customers, we immediately begin to consider how to monitor it. The goal is to find problems as early as possible, and always before our customers.
We start with the basics: disk, memory, CPU load. Still, because of the complexity of the products we develop, there are countless examples of things going wrong: the system fails and we hear about it hours later.
Monitoring software behavior delivers serious value only when it captures deeper system metrics which can be analyzed to gain interesting operational and business insights. To measure these more advanced key performance indicators, we need to have access to internal components and complex data. External monitoring typically does not have sufficiently deep system access and therefore cannot provide answers to questions like these:
—For an online shopping system, how many orders were received in the past hour? Is this significantly different compared to an average day?
—For a publishing system, how much time elapses between submitting an article and that article going live? Does it have unusual spikes?
—For a patient registration system, how many messages are sitting in its queues? What is an average wait time for a message?
—For an online experimentation system, how long does it take to compute experiment results? Does this delay ever become unacceptable given traffic projections?
—For a point of sales system, how many retries does it take to submit data to a payment gateway? Is that number unusual?
In summary, we need a way to boil down advanced system statistics to a definitive and actionable answer to one single question: Is our system healthy?
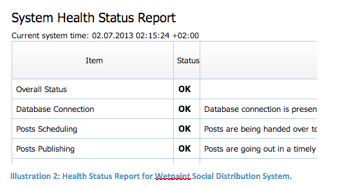 At Wetpaint, where we build a social platform for publishers, all our systems have a special /healthcheck URL. This endpoint is the main asset of our external monitoring system, Nagios, which we use for advanced checks. If it gets no response or an unacceptable response, the system is unhealthy. The operations person gets an alert and the developer gets a call. Together, the team begins investigating what’s wrong. When they log into the system, the same /healthcheck endpoint produces a detailed report — and, if there are failures, it provides specific instructions to follow to troubleshoot the problem.
We built our systems to self-monitor: we know how long it takes to submit a scheduled Facebook post or a tweet, how many of them failed to get submitted during the last 24 hours, whether content ingestion from our partners is working and up to date, how long it takes for data analysis and statistics jobs to finish computation, and countless other metrics. This approach shifted reliability worries entirely to the engineering team, where it belongs. It made the Ops job simpler, providing an answer to the ever important question: “I got a monitoring alert. Do I need to call a developer or not?”
When building each of the checks, we asked ourselves:
—Can this situation be systematically prevented?
—In the future, can this situation be detected early? What data do we need to collect to ensure that?
—Is there a clear, actionable set of steps that should be taken by a Support Engineer to fix the issue? Can these steps be automated?
These questions required deep design changes to our system. We ensured that everything leaves enough of a trace about its functionality, so /healthcheck can deterministically discover when something is broken. To do this, we focused on two crucial requirements:
1) Precision to eliminate false positives and a “cry wolf” approach to alerts
2) Actionable insights. The key is to give a specific roadmap to fix the problem at hand. After all, we woke somebody up in the middle of the night with an alert, the least we could do is to give them enough information to be successful in fixing the problem.
Over time, we arrived at a design that allows us to see the earliest signs of trouble long before anything becomes visible to our customers, and helps us focus on larger business questions. When we get a “Healthcheck Red” alert, we don’t stop working on the problem unless /healthcheck turns green, and we file it immediately as a severe interruption, which we track.
The journey of discovering where our systems can fail is long and tedious, but worthy and important. The trick is not to expect absolute perfection, but to protect ourselves from catastrophic failures by using deep, comprehensive monitoring and early detection.
Just like in real medicine, discovering a problem early and systematically eliminating the root causes of ailments are the keys to successful treatment.
Dmitry Frenkel is director of software development at Wetpaint. He previously worked for Microsoft and led development of Healthcare product lines for Dell. Follow Dmitry on Twitter @dimafr, LinkedIn and Google+.