
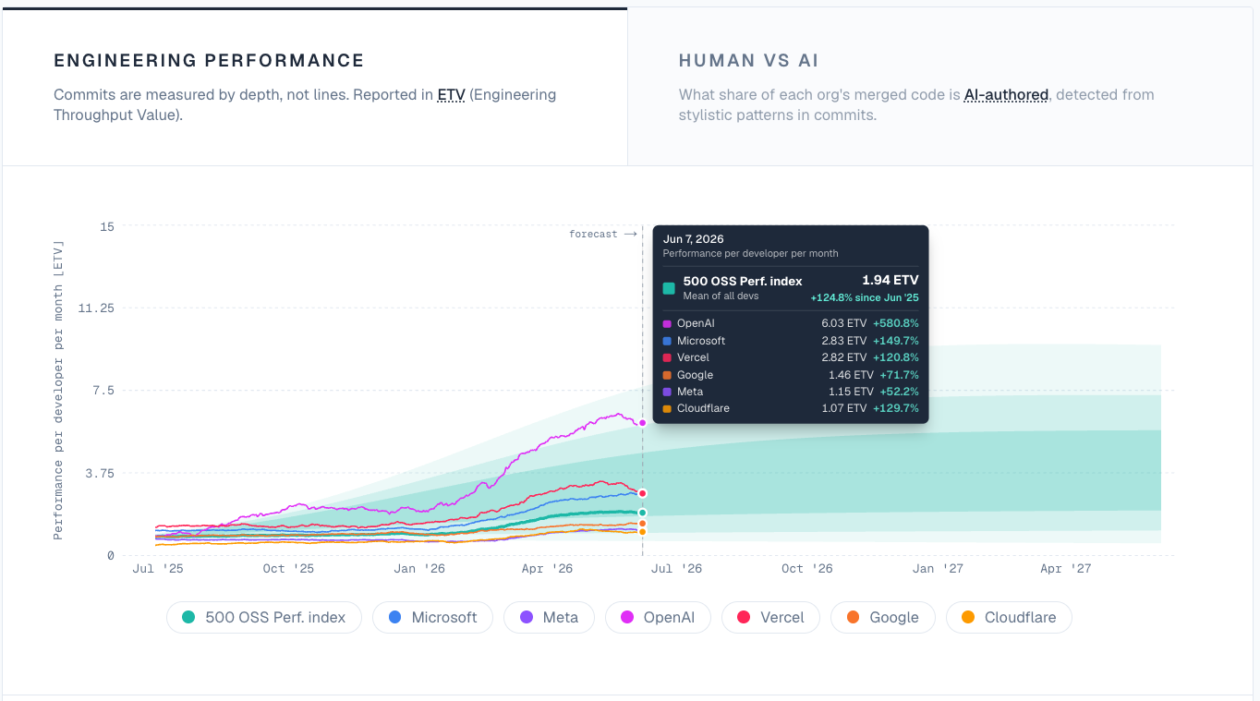
Key Takeaways
- Engineering leaders have more data than ever, but less certainty about AI ROI. Traditional metrics such as pull request volume, sprint velocity, and ticket completion rates measure activity rather than whether AI-assisted development is creating meaningful business value.
- The biggest obstacle to proving AI’s impact is a lack of visibility into what engineering teams are actually shipping. Without insight into composition, roadmap alignment, and AI cost efficiency, organizations struggle to connect AI investments to strategic outcomes.
- Navigara’s commit-level analytics are emerging as a way to close the measurement gap. By analyzing the work that reaches the codebase, engineering leaders can move beyond anecdotes and tool adoption statistics to better understand how AI contributes to productivity, delivery, and business performance.
For the past two years, software development teams have been at the center of the AI revolution. Organizations large and small have rolled out GitHub Copilot, Cursor, ChatGPT, Claude, Gemini, and a growing list of coding assistants with the expectation that engineers would write code faster, ship products sooner, and increase overall productivity.
However, as AI adoption matures, a different question is emerging inside executive meetings and budget reviews: What return are companies actually getting from these investments?
The challenge is not a lack of data. Modern engineering organizations collect more information than ever before. The challenge is determining which data actually reflects value creation. In an environment where AI can generate code in seconds, traditional measures of productivity may reveal less than leaders assume.
Headquartered in San Francisco with engineering operations in Prague, Navigara launched in February following a $2.5M seed round led by Inovo VC with participation from Rockaway Ventures and QQ Capital to give CTOs and engineering leaders a way to measure outcomes across quality, alignment, productivity, and AI impact.
Co-founded by former CTO and engineer Jirka Bachel, Navigara was built around one simple principle: What you can’t measure, you can’t improve in the long term.
“AI changed how engineers work, but not how leaders measure performance,” said Jirka Bachel, Founder and CEO of Navigara. “We built Navigara to replace assumptions with evidence. Not more dashboards, but clarity you can actually act on.”
Using the mindset Bachel developed after surviving a plane crash in 2023, Navigara’s mission is to measure what matters, eliminate guesswork, and focus on improvement.
By measuring engineering performance at scale using the tools engineering teams already use, like GitHub, GitLab, Jira, and Linear, leadership can translate raw activity into the clear performance signals they’ve been missing.
Engineering Teams Have More Productivity Data Than Ever and Less Clarity About Whether AI Investments Are Driving Meaningful Business Value
On paper, engineering leaders should have no shortage of performance metrics. Development teams routinely track sprint velocity, pull request volume, story points, ticket completion rates, deployment frequency, and dozens of other indicators.
AI tools have only expanded that pool of information, providing additional insights into code generation, suggestion acceptance rates, and developer activity. The problem is that activity and impact are not the same thing.
A team may generate more pull requests than ever before without accelerating strategic projects. Developers may accept thousands of AI-generated suggestions without improving product quality or reducing technical debt. Likewise, an increase in code production does not necessarily translate into greater business value.
This is why many organizations find themselves in an unusual position. They have more engineering data than at any point in history, but less confidence in what that data actually means.
“Developer productivity is now a critical issue for almost every company. After the wave of AI adoption, it’s time to distinguish what truly creates value from what companies spend unnecessarily,” says Petr Šmíd, General Partner at Rockaway Ventures.
As AI continues to reshape software development, leaders are discovering that measuring effort is relatively easy, but measuring outcomes is far more difficult. That’s the gap Navigara is trying to close.
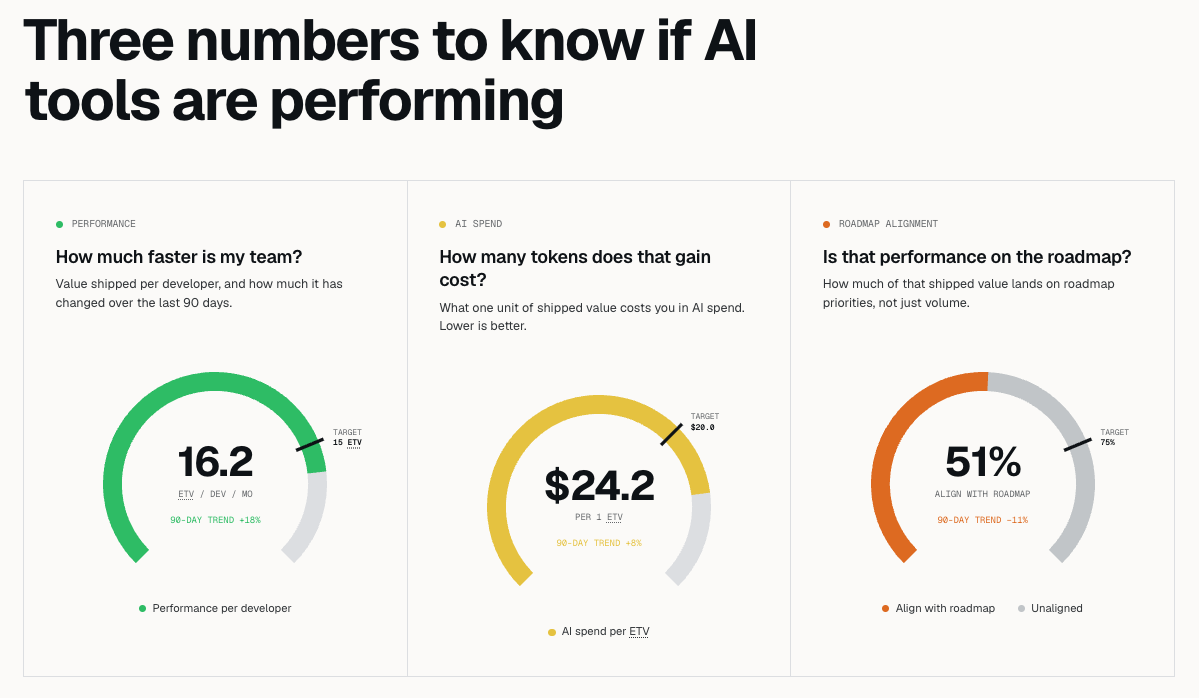
Why Traditional Engineering Metrics Break Down in the Age of GenAI
For years, engineering organizations have relied on a familiar set of performance indicators. Sprint velocity, pull request volume, ticket completion rates, deployment frequency, and story points became standard tools for understanding team productivity.
Generative AI has fundamentally changed that equation. Today, developers can generate boilerplate code, refactor large codebases, and create documentation in a fraction of the time previously required.
As a result, many traditional engineering metrics have become easier to influence without necessarily reflecting meaningful business progress. Pull request volume offers a useful example. A higher number of pull requests may indicate increased activity, but it says little about the importance of the work being completed.
Developer surveys present another challenge. While self-reported productivity can provide valuable context, perception does not always align with outcomes. Engineers may feel more productive using AI tools, but executive teams ultimately need evidence that those tools are improving delivery speed, supporting strategic priorities, or creating economic value.
The result is a growing measurement gap. As AI becomes embedded throughout the software lifecycle, organizations need ways to measure how much work is being performed and whether that work is advancing business objectives.
The Three Blind Spots Preventing Engineering Leaders From Proving AI ROI
If traditional metrics fail to capture AI’s impact, what exactly are engineering leaders missing? Increasingly, the challenge comes down to three critical blind spots, which are the system’s processing capacity and efficiency, roadmap alignment, and AI cost efficiency. Navigara addresses these gaps through three leadership-grade signals: Direction, Proof, and Reporting.
Processing Capacity and Efficiency (Proof)
The first blind spot is understanding where engineering effort is actually being spent. Without visibility into capacity and efficiency, leaders often cannot see how engineering effort is distributed across roadmap initiatives, maintenance work, bug fixes, and technical debt.
As a result, they cannot determine whether AI is helping teams focus more on growth-oriented work or simply enabling them to complete existing workloads faster. Understanding where engineering effort is actually being spent allows leaders to evaluate teams and vendors using objective, consistent metrics rather than assumptions.
Roadmap Alignment (Direction)
The second blind spot is measuring how closely engineering effort aligns with business priorities. Executive teams care less about the number of commits generated and more about whether engineering resources are advancing strategic objectives.
A team can be genuinely busy while spending the majority of its effort on work that doesn’t meaningfully advance the product roadmap. Maintenance tasks, unplanned bug fixes, and internal tooling can quietly consume engineering capacity without appearing as a problem in any traditional dashboard.
Without a way to connect engineering activity to strategic initiatives, leaders can mistake high productivity for high progress, which is a distinction that becomes increasingly difficult to make as AI drives overall activity levels higher across the board.
Connecting engineering activity to strategic business goals is exactly what “Direction” is designed to do: align coding activity with strategic priorities and business outcomes.
AI Cost Efficiency (Reporting)
The third blind spot is connecting AI spending to measurable outcomes. Many organizations have adopted multiple AI tools simultaneously, making it difficult to determine which investments are producing meaningful returns.
The “Reporting” signal addresses this directly, giving leaders a way to measure AI impact through before-and-after baselines rather than assumptions.
Leaders may know how much they’re spending on licenses and subscriptions, but often lack a framework for evaluating whether those costs are translating into greater engineering value. Together, these blind spots explain why so many engineering organizations struggle to answer questions about AI ROI.
Engineering Is the Only Major Function Without a Standardized Performance Dashboard, Making It Difficult to Consistently Measure Business Impact
In most companies, department leaders share a common language for measuring performance. Sales leaders can point to pipeline, conversion rates, and revenue forecasts. Marketing teams can track acquisition costs, campaign performance, and attribution.
Finance leaders have models that connect spending to outcomes. Operations teams use dashboards to identify bottlenecks and improve efficiency. In contrast, engineering often works from a fragmented set of signals.
Managers may review Jira reports, sprint velocity, deployment frequency, pull request volume, incident rates, and developer surveys, but these metrics rarely combine into a clear picture of business impact. They can show that teams are busy and code is moving, and they can even suggest whether a development process is healthy. What they struggle to show is whether engineering work is creating measurable value.
That gap has become more visible as AI coding tools move from experimental pilots to recurring budget items. In that sense, the problem is both technical and organizational.
Beyond private cloud deployment and read-only access, Navigara never trains its models on customer data, making it suitable for enterprise and high-compliance environments while remaining effective in translating raw data into business outcomes.
Why Commit-Level Analytics Are Emerging as the Missing Layer
Commit-level analytics are gaining attention as a potential missing layer in engineering management. Rather than relying solely on tickets, surveys, or tool usage data, commit-level analysis examines the codebase to understand what work is actually being shipped.
That distinction matters. A ticket can describe intended work, and a pull request can show a proposed change, but commits provide a more concrete record of how engineering effort changes the product over time.
“Navigara brought a new layer of trust into our engineering organization,” said Viktor Stiskala, CTO of GTO Wizard. “We used to rely on meetings and opinions about progress. Now we use facts.”
When analyzed in context, commit data can help leaders understand whether teams are spending more time on roadmap work, maintenance, bug fixes, infrastructure, or technical debt. It can also reveal whether increases in productivity are tied to strategic priorities or simply reflect more activity inside the development process.
Frequently Asked Questions
Why Is It Difficult To Measure the ROI of AI Coding Tools?
Most engineering organizations still rely on metrics such as pull requests, sprint velocity, ticket completion rates, and developer surveys. While these indicators can measure activity, they don’t necessarily show whether AI-assisted development is helping teams deliver strategic business outcomes. As a result, many organizations struggle to connect AI spending to value.
What Metrics Should Engineering Leaders Track To Evaluate AI Productivity?
To understand AI’s impact, engineering leaders need visibility into more than volume. Three critical areas include processing and efficiency (how engineering effort is distributed across roadmap work, maintenance, and bug fixes), roadmap alignment (whether work supports strategic objectives), and AI cost efficiency.
How Do Commit-Level Analytics Differ From Traditional Engineering Metrics?
Traditional metrics often focus on activity within the development process, such as tickets completed or pull requests merged. Commit-level analytics examine the actual code changes entering the codebase, providing a more direct view of the work being shipped.
The Next Phase of AI Adoption Will Be About Proof
The first phase of AI adoption in software development was defined by experimentation. Teams tested tools, compared workflows, and looked for signs that generative AI could speed up everyday coding tasks. The next phase will be defined by proof.
Engineering leaders are not flying blind because they lack data. They are flying blind because the data they have often fails to answer the questions executives are now asking. Navigara has launched to translate that raw activity into clear signals using agentic analysis to understand the intent, ownership, and impact of each piece of work, focusing on outcomes and motion.
“Navigara tackles one of the hardest problems in the AI economy: separating real performance gains from noise,” said Matt Małysz, Partner at Inovo VC. “Jirka and his team built a system that treats engineering like a measurable discipline, not a matter of opinion. That’s exactly what modern organizations need.”
Now, engineering leaders can have the “proof layer” they’ve been looking for that uses real data to tell them whether their AI investment is paying off.
Learn more about Navigara today on WebWire.
Disclaimer: GeekWire newsroom and editorial staff were not involved in the creation of this content.
