While the local economy is booming, Seattle is struggling with a homelessness crisis and a shortage of affordable housing. But is the situation starting to improve? How does it compare to five or 10 years ago? As one data point goes up, does the other drop? And are there bright points in the data capturing the region’s livability?
Soon a new tool will help people quickly answer these questions without sending them on down-the-rabbit-hole Google searches or wading through dense annual reports.
The Regional Dashboard will gather and present key indicators tracking the health of the economy, democracy, individuals, households and communities. The idea is that decision makers and leaders in government, business, nonprofit groups and community members will use the same set of data points — a statistical “North Star.” People across sectors will be able to come together and work from a shared starting point when it comes to understanding what is happening in the area and setting collective priorities for improving the region.
The Regional Dashboard is being led by the Seattle Foundation, a 73-year-old philanthropic organization with more than $1 billion in assets that bridges donors and charitable efforts.
The platform will be unveiled next month.
For nearly a year, the foundation has been working on the project, gathering input from numerous local stakeholders and studying dashboards created by municipalities elsewhere.
The dashboard will span King County, which includes the cities of Seattle, Bellevue and Redmond. There’s no price tag or designated funding source for the Seattle Foundation-supported project. Camber Collective collaborated on the effort and Deloitte provided pro bono services.
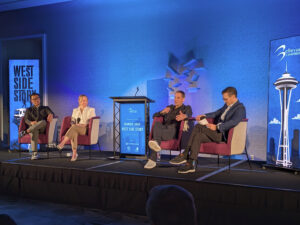
“If we can have consensus and alignment on the values and key metrics and start there, my hope is then it helps us have the right discussions about what is going up and going down,” said Jon Scholes, president and CEO of the Downtown Seattle Association, and one of the stakeholders consulted by the foundation. “We get to real conversations about, ‘how do we get those numbers up,’ or we celebrate the progress we have made.”
The online Regional Dashboard will center on five “thrive indicators” that are each assessed by a primary data point, and supported by an additional 22 metrics:
- Economy will be measured by GDP.
- Democracy is tied to an accountable government and will be checked via voter participation.
- The status of individuals will be measured by people’s self-reported health status.
- Households will be tracked via income.
- Communities will be evaluated by housing costs and the percent of income spent on rent or mortgages.
The other data will be organized within these five main categories, and include statistics on education, environmental health, transportation and food security. Many of the measures will be further broken down by race, gender and ethnicity. The idea is to not necessarily focus on a problem, say the number of people experiencing homelessness, but to look at contributing upstream factors such as income relative to housing prices or healthcare issues.
The Seattle Foundation is eager for local tech leaders to plug into the project, engaging in the conversations around the indicators and possibly providing additional data.

The main focus is examining the region’s growing socioeconomic inequality. Because while many people in the Puget Sound area are enjoying tremendous financial success, many others are struggling. Tony Mestres, president and CEO of the Seattle Foundation, said when he shares statistics on community conditions including level of education, youth and family homelessness and health disparities, people often can’t believe that there is such a large divide.
“We have to have a common North Star for us to be able to address this gap between how we’ve got incomparable assets and completely ridiculously unacceptable inequities,” Mestres said.
The hope is that the Regional Dashboard will offer an accepted set of politically neutral data points for stakeholders to jump off from when sorting out policies and programs to address the area’s challenges.
“On any issue we choose, starting with a data-driven approach is really important,” said Carrie Cihak, chief of policy for the King County government. Cihak served on the advisory board for the creation of the dashboard.
The dashboard is part of a broader project called the Civic Commons, which includes a second initiative called We Belong Here. That effort is working to foster a sense of community and connection in a region built from residents with diverse backgrounds and including people who’ve lived here for generations to those who recently relocated to the Northwest.

The question, said Michael Brown, the foundation’s lead on the Civic Commons project, is how do you create an identity where “we feel that this is our place where we can live, where we can work, where we can play? Where it belongs to everyone.”
Many municipalities have developed their own data dashboards. Silicon Valley and Minneapolis present big-picture numbers like Seattle will, but have the added feature of comparing their data to other regions. San Francisco and Austin have indicators that quickly dive deep into data, making it more difficult to quickly take an area’s pulse.
“The key thing is the comparative elements in order to put things in context. Otherwise, the numbers are hard to get your head around,” said Brian Brennan, senior vice president of the Silicon Valley Leadership Group, which helps produce a dashboard for their region. That project has a narrower objective, specifically the valley’s economic competitiveness versus other cities.
Brown said that the Regional Dashboard might add regional comparisons in the future, but for now they’re keeping a local focus.

The dashboard will pull data from reputable sources, primarily government research and surveys. With the abundance of data available, part of the challenge will be convincing people to use dashboard as a main information source.
“The question is really going to be whether this can be the common organizing framework, or it becomes just one more framework,” Cihak said. Though either can work, she said, provided the dashboard’s numbers are still a central part of the conversation.
“As we think about the site, it’s not going to be just about the numbers. But we want to be able to capture stories of company X did this or organization Y did this, or here’s something that happened as a result of the dashboard,” Brown said.
“It’s speaking to — it might sound dorky — the ‘power of us,'” he said, “What we do together that hopefully starts to shift some of those trend lines in a different way.”
Editor's Note: Funding for GeekWire's Impact Series is provided by the Singh Family Foundation in support of public service journalism. GeekWire editors and reporters operate independently and maintain full editorial control over the content.