
Editor’s note: This guest post is written by Matt Rubright, an operator turned banker at Silicon Valley Bank.
Building an effective pitch deck is a unique topic of conversation in the startup ecosystem. It’s one of the few topics where every startup has created one before, many people have written playbooks about how to create them, yet many early stage companies I speak with are still looking for guidance. What I surmise from hearing this time and again is that pitch decks are so important to the livelihood of a startup that we’re constantly in the pursuit of more perfect information.
In that spirit, I turned to Silicon Valley Bank’s unique data set that has been aggregated over the years and in various markets to provide tangible, quantifiable guardrails based on the successful fundraising processes of our clients. We then pressure tested our findings from the investor perspective with Randall Lucas of Voyager Capital, a first-round VC having led or co-led over 70 Seed and Series A rounds, to ensure we’re surfacing the most valuable points in the research.
Companies in the study
Our data set is comprised of Series A companies from diverse geographies, industries and founder experience levels. By doing so, we’re able to surface insight that has broad application in the innovation economy.
No client-specific data is presented in this post to maintain confidentiality.

Investors & funding outcomes
The pitch decks we evaluated came from companies that garnered highly credible investors and were able to close larger rounds than asked for in their pitch decks.

What we observed
Pitch deck length: Keep it short + appendix. We saw a great deal of variation in the number of slides as shown below. If you’re grappling with the length of a pitch deck, compare the slides in to the Sequoia template. If you have many additional slides or expound upon sections for multiple slides, it’s probably worth leveraging an appendix section. At a minimum, ask yourself if the slide is critical to the story you are telling or if it’s supportive in nature. Randall advises entrepreneurs, “Shoot for 10–12 slides knowing you’ll wind up at 14-16 — entrepreneurs love to tell their stories, but you really need to ruthlessly focus.”

Problem statement: Be clear & concise
Every pitch deck had a problem statement but there was a decent amount of variability to how it was presented. The two most prevalent approaches we noted were “User X has Y problem” and “market A has B inefficiency or missed value.” Just shy of half (46 percent) actually specified a specific user in their problem statement; the remainder focused on the market problem/inefficiency approach. In speaking with Randall, there isn’t a “right” approach between the two options, as long as it’s clear what the company is solving for.
A tactic that doesn’t resonate is merely describing how much better the future world would be with everyone using your product. “Asking investors to ‘imagine a world where…’ is not a great start to understanding an early stage startup’s opportunity,” says Randall. “Focus on pain that customers are having today, and on articulating sustainable competitive advantage — and the ‘great and glorious future’ will be clear.” Be concise in the problem statement — 1-to-2 slides maximum here.
Market Size: Billions can make sense within a context
If you’ve reached the point of pitching institutional venture capitalists, you must be able to prove that the market you operate in is capable of producing venture-size returns. We could belabor what the minimum market size is or how to assess a venture sized return, but we’ll defer to those who’ve already explained these concepts well (great illustration from Mark Suster here). That said, the desired VC return profile does have important implications on the approach to estimating size.

As noted in the graphic above, a top down approach is the significantly more popular. In terms of total dollar size, Randall told us he didn’t have a strong expectation that founders should present deep rigor around the estimate, however this does not negate thoughtfulness in the approach. “Many of the best market opportunities don’t have historical data available, or don’t even fully exist at the time you’re pitching,” he says. “You need to show that your addressable market is plausibly big enough and lucrative enough for your goals.”
Saying your market is $3T because your industry is “retail” does nothing for a potential investor because it’s too high level to tie to your company in any manner. The worst case scenario is having an investor question your market size and lose their confidence in you before you’ve really talked about what it is you do. Retail isn’t an appropriate context for your opportunity, but perhaps retail supply chain SaaS spend is. Furthermore, pitch decks that provided massive market sizes were often contextualized within an industry mega trend or paired with an addressable opportunity breakdown to show what is actually addressable.
Less prevalent in both our data set and in Randall’s experience are startups that complement their top down with a bottom up approach as well. Extending our prior example, a large retail supply chain market can further be contextualized by starting with how much on average a Fortune 100 organization spends on supply chain software today. Extrapolating from this data point can help show cost that you’ll attempt to displace at a minimum. Randall indicated he would see presenting both top-down and bottom-up calculations as an positive exception, not the rule. “The more surprising or non-obvious the market opportunity is, the more support it demands,” he says. “Don’t burn a lot of time and screen space on reinforcing readily grasped, credible market numbers.”
Your solution: Demo like a founder, not customer support
Your problem statement, market size, competitive landscape slides don’t deep dive into granular detail, so why should your product demo? From what we observed in the study, founders are using simple visual tools to help provide product context but aren’t providing a level of detail to onboard investors as successful users.

Perhaps the greatest indicator of the 50K foot approach is the prevalence of product screenshots over any other medium. Don’t forget, a pitch deck is just a first step — you’ll likely get into a much deeper product review during the diligence process, so don’t attempt to ramp up investors on the nuance of your product at this point. As you’ll note in the above graphic, 18 percent of companies didn’t use any product visualization in their presentation deck. However, we don’t want to draw conclusions here as it’s possible founders showcased their product outside of the presentation entirely.
“For an entrepreneur, your product is your baby. Of course you think it’s beautiful and exciting. To a venture investor, though, all the baby pictures kind of look the same,” says Randall. “I generally don’t like to see a product demo in the first meeting.” Exceptions would be products where user experience or visualization are truly core elements. Focus product slides *only* on key product aspects that drive your unique go-to-market edge or sustainable competitive advantage.
Traction: Showcase two types of credibility
A successful pitch deck will successfully weave together quantifiable metrics and customer profiles to establish credibility behind what has been accomplished to date. We’ll briefly touch on both below.
Metric Showcase
Knowing that our study covered a wide range of industries and business models, it would be improper to place targets on metrics to illustrate expectations for a Series A (we’ll likely address in a future post). Regardless of the industry or business, we did see three distinct categories across a majority of pitch decks that should be accounted for.

Customer Showcase
If metrics are the quantifiable success of the company, customers are the qualitative context that helps put it in perspective. Most pitch decks leveraged one or more of the below tactics to further ground their metrics in a customer context.

From what we’ve observed both in this study and in working with early stage companies, these illustrative approaches lend to different types of credibility:
- Customer logos: brand credibility — we are diligenced and paid by trusted brands!
- Testimonials: user passion credibility — our users can’t live without us!
- Case studies: end-to-end solution credibility — we can repeat this again!
- Pipeline: forecast credibility — look at the revenue we’re going to have!
As you look to build your deck, be cognizant of why you choose the above mediums and how it reflects on the state of your business. You should be able to show traction that is both quantitative and qualitative in nature.
Competition: Use it to demonstrate your strengths
Every founder would like to say they are completely unique and they’ve found completely white space. It is almost never true. For a vast majority of startups, there are competitors, potential competitors, or substitutes for solving your customers’ problem. Not addressing this can look like you don’t know the space well enough or are obscuring detail. It’s also a missed opportunity to tie in your competitive advantage.
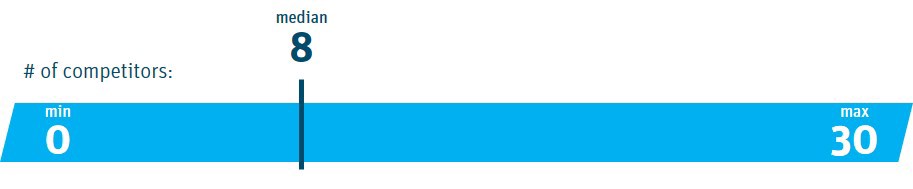
As indicated by the data, most startups aren’t shying away from competition, but instead using this section as an opportunity to educate potential investors on how the startup will carve out their space. To illustrate this point, the majority of pitch decks leveraged a 2×2 graph to show position relative to competitive threats.
When asked about the 2×2 visualization, Randall urged founders not to neglect considering magnitude vs. specificity. “When you choose how to present the ‘market map,’ it’s important to note the scale of competitors and substitutes, but also how specific and direct the competitive threat is,” he said. In other words: who else can do what you’re doing and how well are they resourced to do it? For example, a large enterprise may have the magnitude (or scale) to compete with you, but may not choose to do so because it doesn’t make sense to pivot resources to build in your narrow space. However, if a competing startup raises a significant round, they can solve a specific problem and have the capital to move quickly. Your ability to speak to these dynamics in a pitch will help illustrate your understanding of the real threats to your business in the market.
Go to market: Sales channels + pricing at a minimum
Perhaps the widest variability of content was observed in go-to-market approaches. It was interesting to observe that other sections we address throughout this blog post had definitive titles and a discrete number of slides, yet GTM was rarely ever titled as such. The most notable approach observed was a combination of sales channels and pricing strategy. In speaking with Randall, we attribute this variability and lack of depth to how tried and true markets and business models are. For example, enterprise B2B SaaS is very well defined, so there is no need to belabor the mechanics of a GTM.
With that in mind, Randall did emphasize that you must answer two questions:
- How do you get the “kindling” started for very early sales if you’re still discerning product market fit?
- How do you think you’ll scale up the sales model once the fire is going?
Growth projections: Work within a knowable range
Similar to market sizing, projections help illustrate the aspiration and opportunity ahead of the business. Projections without any rigor will show lack of knowledge and/or understanding, while getting too granular in your attempt to model growth is unrealistic, cuz ya know, early stage startup.
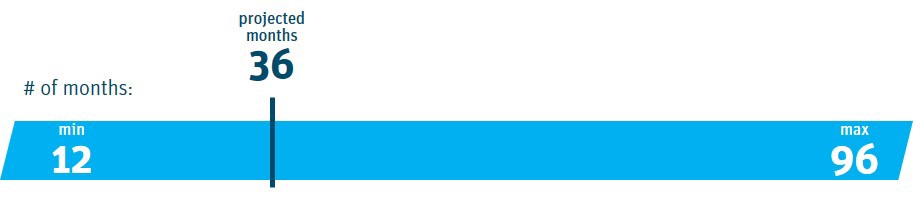
A quick way to gut check your forecast is by asking yourself how “knowable” the industry and business model truly are. If you’re entering an industry that is fairly well understood or you employ a proven business model (think enterprise SaaS), you may have the ability to show longer time frames with higher confidence. From what we’ve heard from Randall and what’s we’ve seen from clients historically, 36 months is probably a good projection horizon. It’s long enough to show growth potential, but it doesn’t put you firmly into an “unknowable” range.
In terms of the metrics you choose to project, the two most common approaches were:
(a) revenue + # of customers + headcount, or
(b) income statement
In speaking with Randall, option A was the much preferred approach as it anchors on the most important drivers, but doesn’t attempt to forecast income statement line items that end up being based on very little knowable data. Revenue was by far the most common top prioritized metric, but as noted above there are many other top line metrics a company could optimize for.
Other important notes…
- Being cash flow positive: This may seem important to a founder, but don’t forget your Series A investors want to see rapid top line growth and another equity round to fuel continued growth and long term exit opportunities. Being cash flow positive isn’t the priority.
- Assumptions: None of the pitch decks stated explicit assumptions with their projections. The numbers aren’t perfectly knowable and having a reasonable approach is enough to satisfy investors during the pitch.
Team: Highlight what makes you credible
All pitch decks had a team slide that was either near the onset or the close. Team slides were primarily limited to the founders, but occasionally included other key team members. The data hierarchy on these slides was typically person A name, short title or statement about person A, previous companies and/or exits for person A. Many of the team slides observed also allocated space for existing investors and key mentors.
“If you’re going to include advisors — other than employees or directors — you get far more credibility if you can also say that they’re investors. It’s easy for a Ph.D. or retired CEO to lend you their name — but will they put even a modest sum at risk?” asked Randall. “I personally discount non-investor advisor names in a deck.”
All things considered, you should be able to accomplish this with one slide.
The Ask: A conversation starter
I’d imagine this is the most anxiety inducing slide for most founders. You’ve told your story and now it’s time to land the punchline.

Most investors want to see a dollar ask. After all, you’ve already told the investor what you expect to build and the expected projection for the business — shouldn’t you be able to project how much it’s all going to cost?
Beyond the capital ask, we saw common elements on the ask slide across many of the decks:
- Expected milestones and metrics to be achieved
- Projected spend allocation
- Remaining cash, burn rate and runway
- Expected participation from existing investors (if any)
From Randall’s perspective, No. 1, No. 3 and No. 4 are very important. He indicated No. 2, the specifics of spend, is helpful mainly when the business model doesn’t make it obvious where the funds will go. “OpEx — and head count in particular — is almost always the core spend driver. More detail in the use of funds is only helpful if it doesn’t clearly follow from a head count increase that ties to the GTM and product efforts,” he said.
In summary, don’t forget this presentation is the first step in a dialogue. By presenting a transparent ask with the above context around it, you’ll be more likely to have a fruitful conversation where potential investors can understand where you’re trying to go and how they can play a part.
Bonus round: wildcard slides
Through inventorying every slide in a large number of pitch decks, we came across interesting slides that are not always discussed in pitch deck discussions, but worth considering for any startup.
- TL;DR slide: A summary slide at the beginning to highlight the key information to follow. Randall indicated this was very helpful and often found in above average pitch decks.
- Capital efficiency slide: Some of the pitch decks included a slide to show revenue and customer growth achieved with the previous capital. A handful of these slides also included net burn, remaining months of capital and total cash on hand.
- ‘Explainer’ slides: I use this as a catch all where you want to dive deeper into things like tech infrastructure, product, hiring plans, etc. These are fantastic appendix slides.
- Appendix: We believe founders should create an appendix section. You won’t always use it, but supporting information can be helpful in a pitch.
About this post
Silicon Valley Bank is dedicated to helping founders increase their probability of success. Be on the lookout for more data-driven posts in the near future.
Voyager Capital is a venture firm providing entrepreneurs with the resources, experience and connections to build successful technology companies. The firm prefers to invest in the software, analytics and cloud infrastructure startups. It is based in Seattle, Washington and was founded in 1997.
For more writing from Randall Lucas check out his blog here.
NOTE: The views expressed in this article are solely those of the author and do not reflect the views of SVB Financial Group, Silicon Valley Bank, or any of its affiliates. Companies referenced throughout this document are independent third parties and are not affiliated with SVB Financial Group.


