When I opened a new online tool for mapping changing temperatures, snow pack and rainfall across the Pacific Northwest, I immediately zoomed into the dot representing Seattle. Then I shrank the nearly 150 years of data available to span only my lifetime.
Because while global warming is a planetary phenomenon, with this tool, it was all about me.
And according to Tableau Software’s Dan Cory, that’s a totally normal response.
This sort of visualization is powerful because it helps people “learn about themselves,” said Cory, a principal technical advisor at Seattle-based Tableau who helped create the free tool.
“That is what you can really feel,” he said. “Visualization really helps you find yourself on a map.”

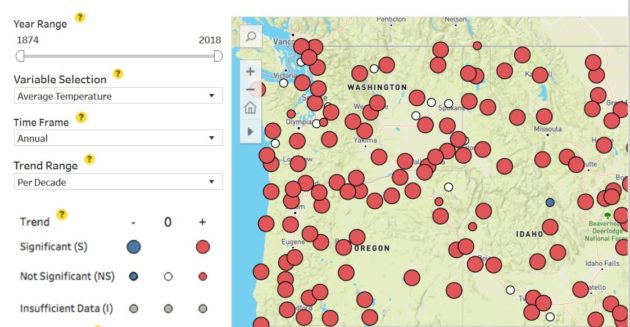
And what the maps and charts show are red, pimply dots indicating warmer temperatures pocking the Seattle region.
Over the past century, the Seattle area has warmed 1.52 degrees Fahrenheit (°F) on average, while the state overall has heated up slightly more (1.85°F).
What’s even more troubling is the 40-plus years that cover my personal existence. During that recent window, the state was even warmer, ticking up slightly less than half a degree per decade on average. It’s not a hopeful record.
The Pacific Northwest Trend Analysis tool covers Washington, Oregon, Idaho and Western Montana. The Office of the Washington State Climatologist in partnership with the University of Washington’s Climate Impacts Group recently released the interactive site. Tableau donated its time and expertise on the project, which took about four months of part-time work to complete.
The default map displays 137 weather stations that for many decades have taken daily measurements of temperatures and rainfall. The tool also includes the “snow water equivalent,” which is the amount of water held by the snowpack. Those data are available for Washington only.
“It’s a clear way to present what is already happening,” said Karin Bumbaco, the assistant state climatologist for Washington and a researcher with the UW’s Joint Institute for the Study of Atmosphere and Ocean.
Globally, there is also a clear, long-term warming trend. And the past three years have been the three hottest on record, according to the the National Oceanic and Atmospheric Administration (NOAA), with 2016 ranking warmest so far.
Last month, international scientists warned that the world will experience dire effects from climate change sooner than expected unless we quickly embrace significant cuts to greenhouse gas emissions.

In a report by the Intergovernmental Panel on Climate Change, scientists said that the planet must dramatically curb emissions of carbon dioxide and other pollutants over the next dozen years to cap warming at 1.5 degrees Celsius (or 2.7 °F), or risk serious flooding, droughts and heat waves.
This month, Washington voters defeated Initiative 1631, a ballot measure to combat climate change that was supported by numerous leaders in the technology industry, while California has battled against the most deadly wildfires in state history.
President Trump continues to question the causes and seriousness of climate change, and some members of the public remain uncertain about scientific evidence that makes a strong connection between greenhouse gas emissions and warming.
Kathie Dello, associate director of the Oregon Climate Change Research Institute, is a fan of the new trend analysis tool, which is an overhaul of a previous app. In her role, Dello explains climate issues with government agencies and the public. The tool allows her to quickly make maps showing changes.
“The red dots tell the story better than any graph can,” Dello said. “You see the trends across the region.”

And the tool is simple enough for anyone to use.
“We want it to be available to the general public and that should include a middle-schooler doing a school report,” Cory said. “So we spent a fair bit of time fine tuning the interactions so they would see the right data.”
Former UW student Matthew Rogers, now a graduate student at the University of Oklahoma, took the lead in building the visualization.
The researchers caution that while you can pick specific weather stations and narrow windows of time, the data are more accurate when taken over a larger time and space, and focusing on outliers on either end can distort the bigger picture.
An interesting takeaway from the data is the lack of a clear trend in rainfall. Climate scientists have predicted that global warming could bring slightly heavier rainstorms locally in fall and winter, and drier springs and summers.
“There is so much more variability in precipitation from year to year, there hasn’t been a trend,” Bumbaco said. That doesn’t mean that one won’t eventually emerge, but it’s not statistical present at this point.
One of the app’s new features is the ability to show which data show a trend, and which are so pronounced that the trend is statistically significant, meaning they’re not a result of chance.
Including the statistical information shows how robust the data are. “It’s hard for skeptics to claim they don’t see a trend,” Bumbaco said.
“I would hope that would convince those who may doubt that we’re seeing changes already in the Pacific Northwest.”


